 Next.js
 React
React TypeScript
 Tailwind CSS
 Framer Motion
 Recharts
 Lucide
 ESLint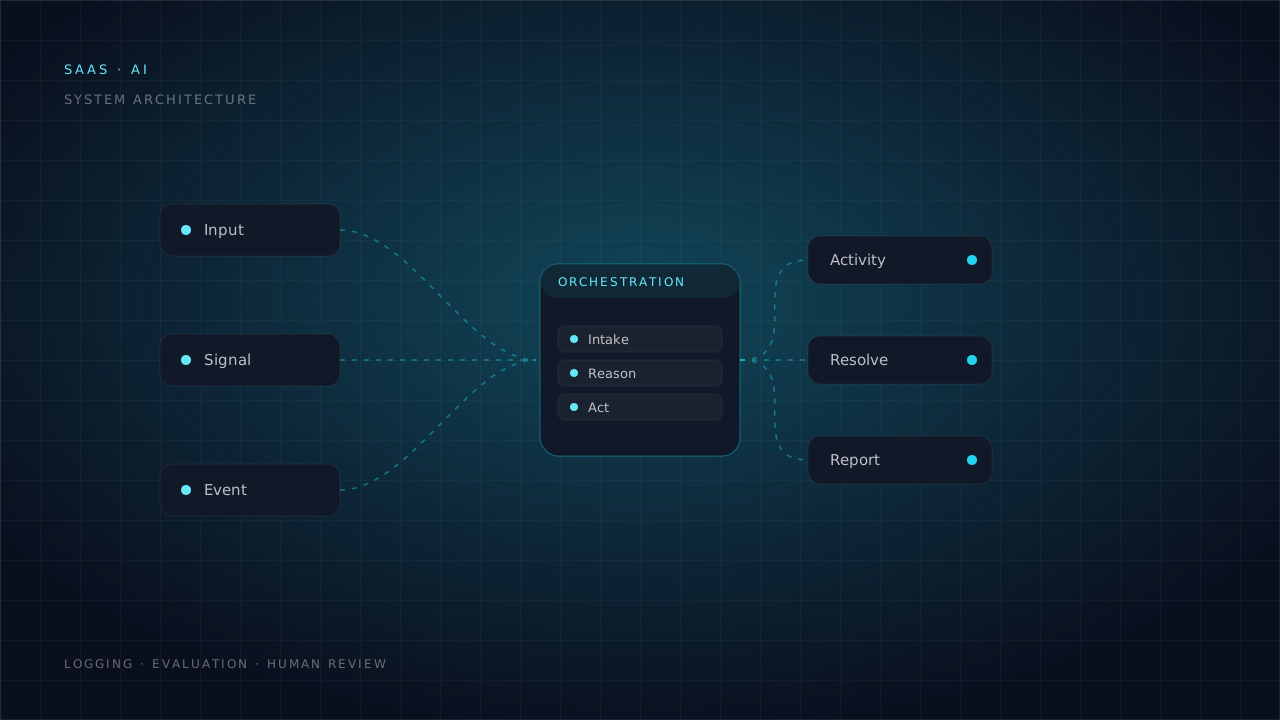
SaaS / AI
Smart CRM
A multi-tenant CRM with AI assistance built into the record, summarising history and surfacing the next action for every account.
- Next.js
- TypeScript
- PostgreSQL
- OpenAI
- +1
 PostgreSQL
 OpenAI
View Case Study
Case Study / SaaS / Security
CyberThreat Mesh / 10 weeks
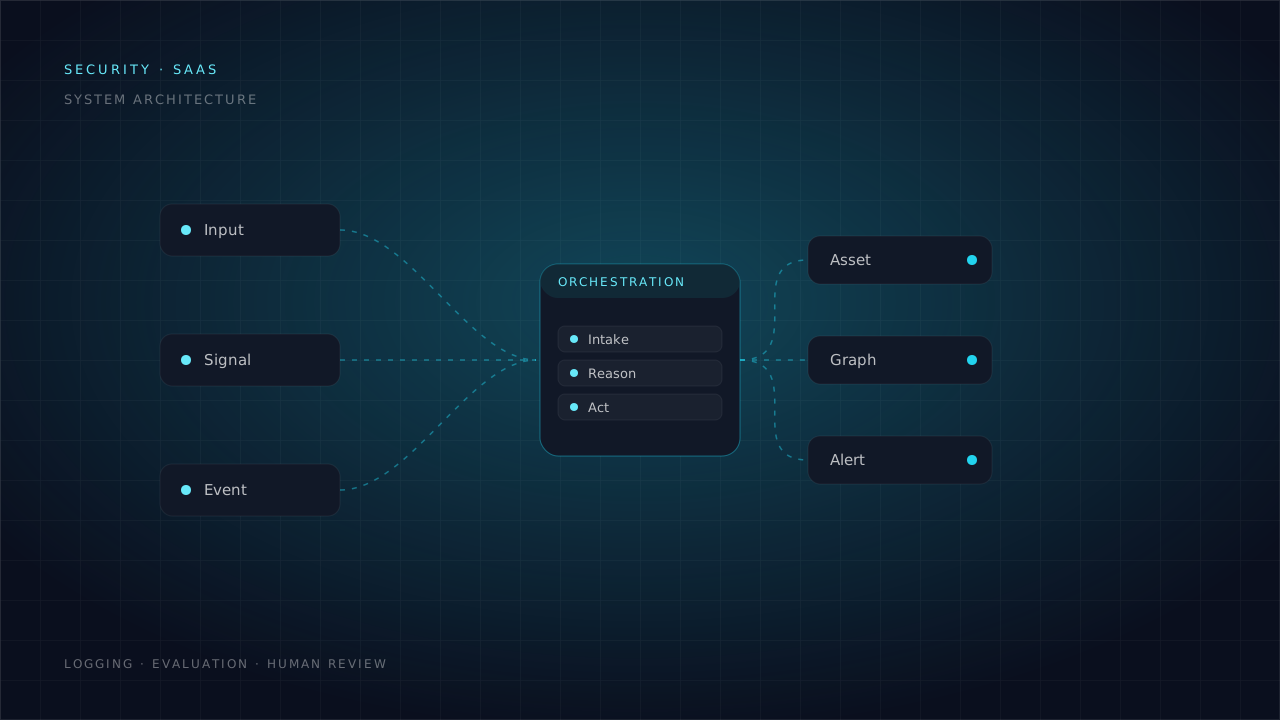
A 20-screen interactive security SaaS that renders a cloud attack surface as a living SVG attack graph — agent control, vulnerability feeds, temporal replay, compliance briefs, RBAC and audit trails.
Overview
The brief asked for a complete, navigable security-product surface: a 20-screen application that demonstrates what an autonomous AI red-teaming platform looks like — attack surface mapping, blast radius analytics, agent control, and governance — implemented with honest front-end engineering. The product context is enterprise cloud security operations: SOC analysts, threat hunters, cloud security architects, and GRC auditors triage identities, workloads, and data stores continuously, and time-to-visualization plus clarity of the attack graph are core differentiators.
Challenge
The situation before the engagement, in the client's terms.
Security products that visualize attack graphs and threat telemetry share a recurring failure pattern: they are visually dense, slow to render, and hard to navigate. The project set out to fix the five pain points that typically make these products unusable for triage.
Naive graph layouts overlap nodes, let edge lines collide with labels, and require constant pan/zoom to read — unusable for triage.
Many dashboards force a dark theme or bolt on a light one with washed-out neon colors that fail WCAG contrast on light backgrounds.
Fixed sidebars that overlap sticky headers, or headers that scroll away, are common layout defects in dashboard UIs.
Long animation delays and blocking loading states make data-dense dashboards feel sluggish even when data is local.
A product with this many distinct workflows needs a reusable component and design system or implementation cost multiplies per screen.
Objectives
What the build needed to achieve before implementation began.
Implement 20 fully populated product screens across four navigation categories
Ship a dual-theme engine where the same risk color tokens are WCAG-compliant in both themes
Build a reusable SVG attack graph with guaranteed minimum node spacing (spec ≥140px, implemented ≥146px)
Enforce a strict layout architecture: sticky header, fixed sidebar, isolated scrolling viewport
Cap every animation at ≤0.15s with ease-out easing and eliminate skeleton blocking
Make every chart, filter, slider and scrubber genuinely interactive against the dataset
Verify clean lint, passing production build, and all routes serving HTTP 200
Design a typed data layer that can absorb a live backend later without structural changes
Solution Design
The approach that addressed each challenge above.
We built a single-page-product shell: a living attack graph where risk is encoded by color, glow and label, operational screens built from the same dataset, and a dual-theme design system so the same product works in tactical dark mode and high-contrast light mode without layout changes.
A seeded mulberry32 PRNG on a 3-column grid (170px cells, ±12px jitter) guarantees ≥146px node separation by construction — provable, and identical on server and client.
Quadratic Q-bezier paths with a 26px perpendicular bend keep parallel edges apart from labels, which render as bordered pills offset alternately top and bottom.
Deep WCAG risk colors in light mode (#9F1239 critical, #B45309 high, #0369A1 medium, #065F46 low) and neon equivalents in dark mode, derived via color-mix() for badges and borders.
Sticky header at z-40, fixed sidebar at z-30 below it (top-16, h-[calc(100vh-4rem)]), and an isolated main scroll viewport — no overlap, no scroll-away.
All 70+ Framer Motion calls capped at ≤0.15s with ease-out easing; no blocking skeletons, panels render instantly.
The attack graph component powers the landing hero, public explorer, main canvas, temporal timeline, and investigation workspace — parameterized with filters, highlights and dimming.
UI code written against real contracts from lib/types.ts; mockData.ts implements them (~120+ records), so a live API swap later is a data-module replacement.
Recharts SVG attributes reference var(--risk-*) tokens — every chart flips theme-correct with zero re-render logic.
Capabilities
What CyberThreat Mesh does in day-to-day use.
Every cloud asset is a node, every IAM trust, network route and data flow an edge — with risk status encoded by color, glow and label.
A deterministic seeded grid layout guarantees ≥146px minimum node distance (spec ≥140px) while still looking organic.
Quadratic bezier paths with a 26px perpendicular bend keep parallel edges separate from labels.
Class-based dark mode with the same risk color tokens WCAG-compliant in both tactical dark and high-contrast light themes.
20+ Recharts visualizations reference CSS variables, so charts re-color on theme switch without a re-render.
A 150ms Framer Motion drawer shows CVSS, exploitability, edge count, MITRE techniques and tags for any node.
Four autonomous agent cards with workload gauges, token counters, latency stats and thought-process execution trees.
A scrubber replays T-30 → T-0; the visible graph is re-sliced from the node and edge datasets per interval.
BFS-based 2-hop sub-graph extraction around any selectable node with lateral chain forensics.
Framework selector (SOC 2 / ISO 27001 / MITRE / custom) toggles a generated readiness brief with gauges and coverage charts.
A 35-day exploit heatmap generated deterministically from a seeded PRNG, with CVE backlog cards and threat-intel news.
Three live sliders (instances, IAM identities, simulations) recompute a monthly subscription estimate and savings donut.
Technology Stack
Outcome
What changed for the business after launch.
20
Routes live
All 20 product routes statically prerendered and verified HTTP 200.
≥146px
Node spacing
Deterministic graph layout guarantees minimum separation by construction.
0
ESLint problems
Lint clean after fixing 2 React-hooks violations and 6 unused symbols.
≤150ms
Motion budget
70+ animation calls capped at 0.15s — instant dashboard feel, no skeletons.
Interface
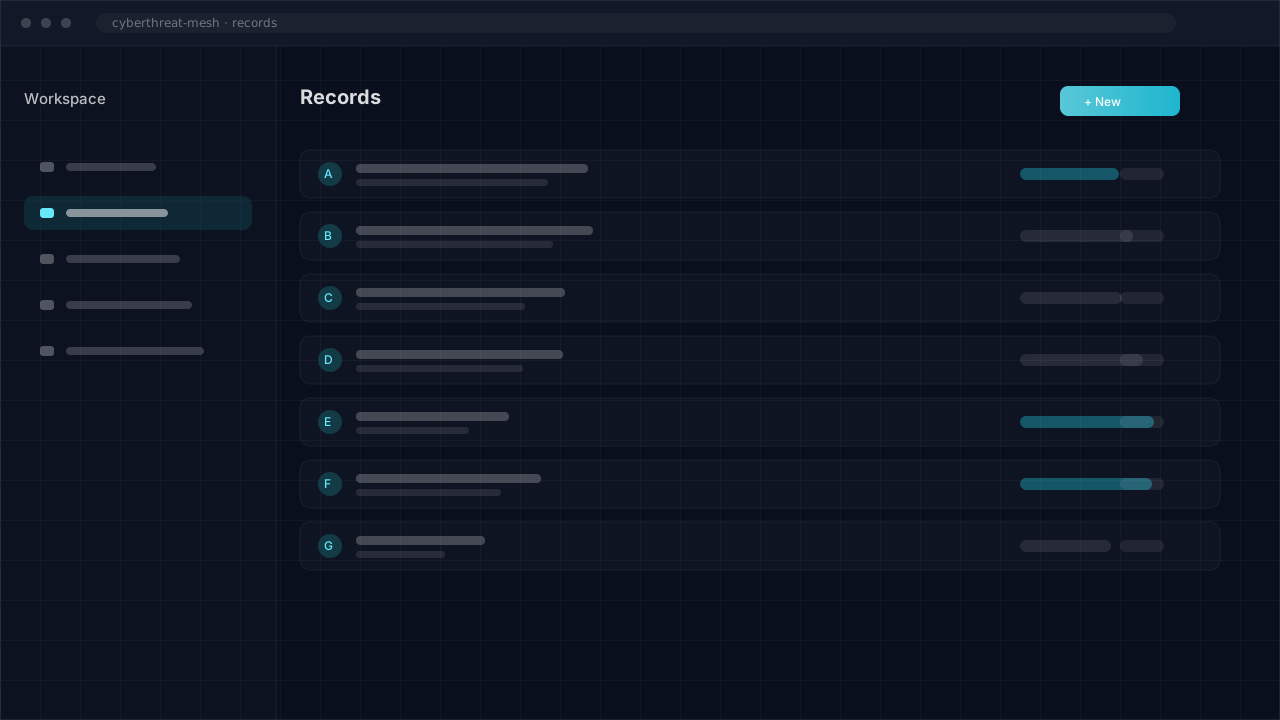
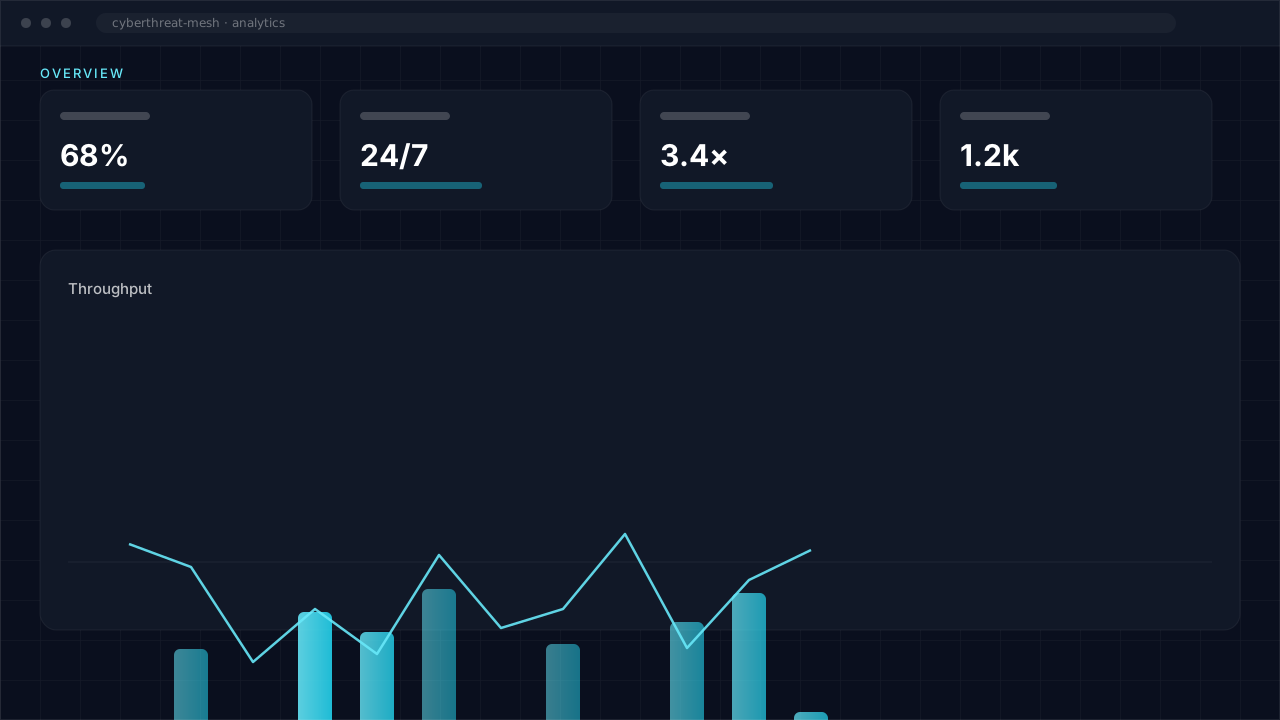
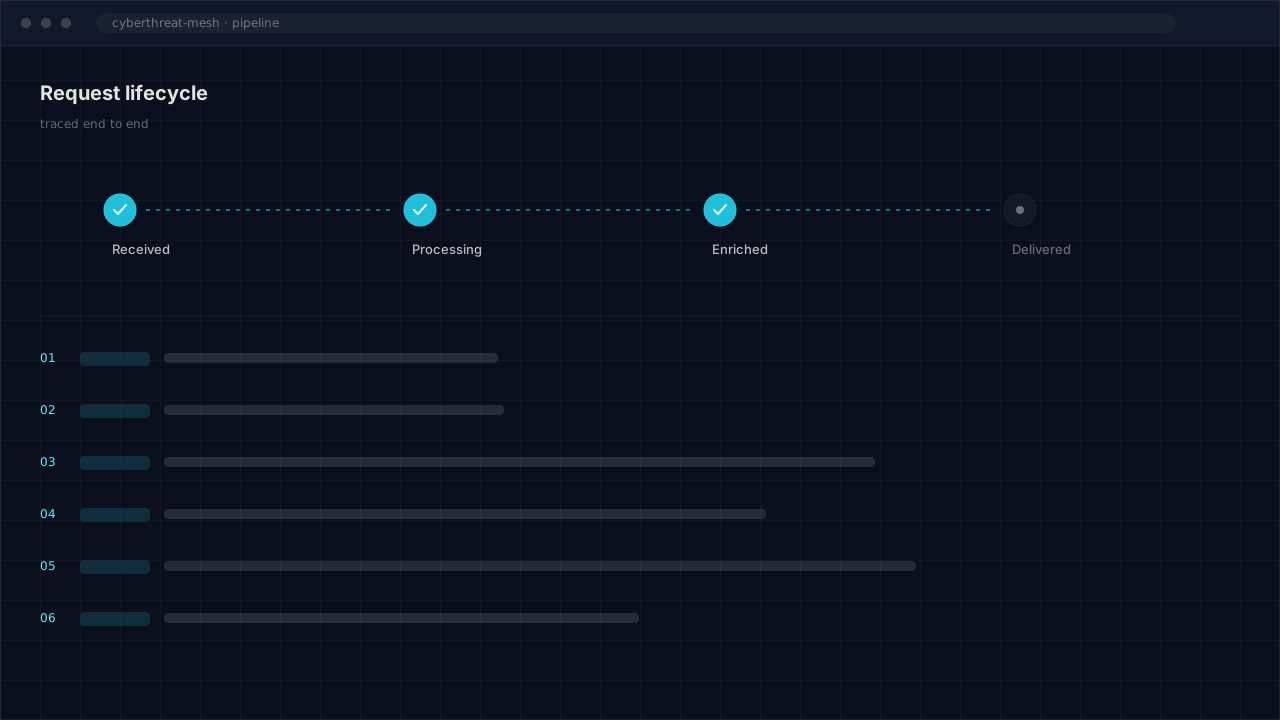
Screens from the delivered system.
Conclusion
CyberThreat Mesh delivers a complete 20-screen, dual-themed, statically generated security-product UI. Its durable engineering value: a reusable deterministic SVG attack-graph engine with a provable minimum-spacing guarantee, a CSS-variable design-token system that keeps risk semantics correct in light and dark themes, a z-index-disciplined layout architecture with isolated scroll, a 150ms motion budget across 70+ animations, and a typed simulated data layer that stands in for a future backend. The build is green, lint is clean, and every route was verified serving HTTP 200. Everything inside is implemented; everything the product represents — AI agents, telemetry, integrations, governance — is a labeled simulation of what such a product would show.
More work
Other systems built on similar foundations.
SaaS / AI
A multi-tenant CRM with AI assistance built into the record, summarising history and surfacing the next action for every account.
View Case Study
AI / Web Application
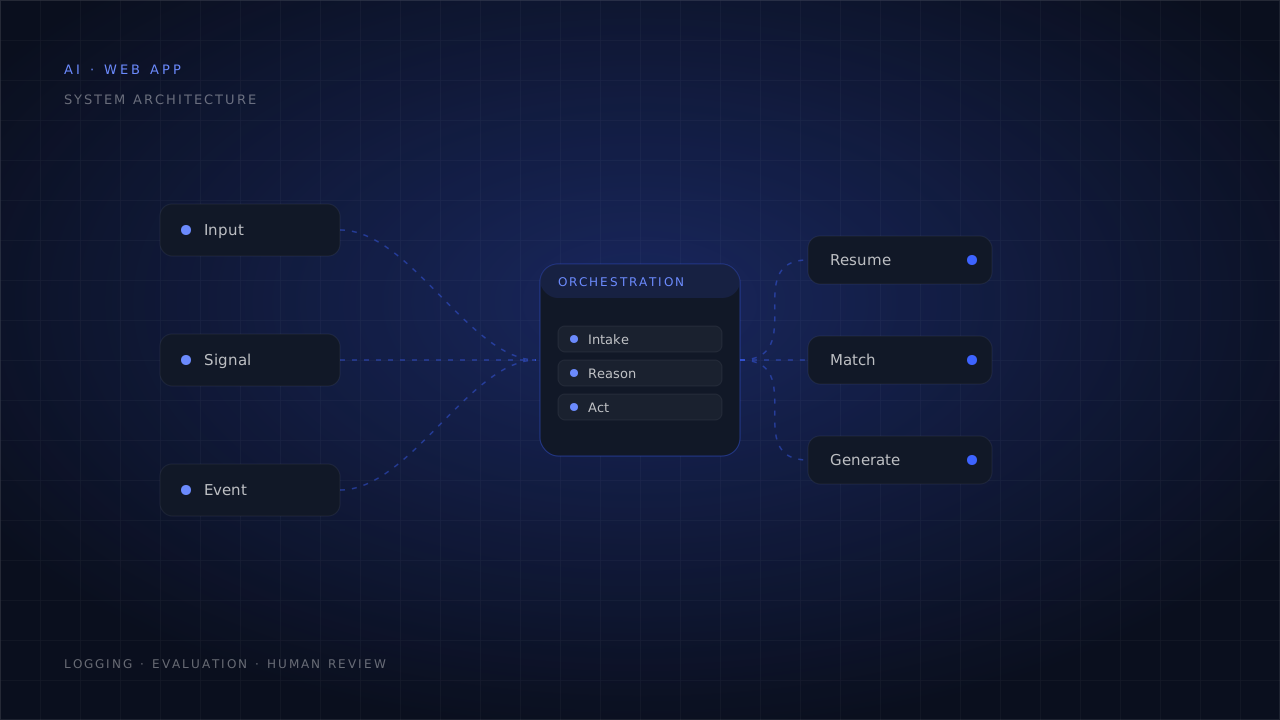
A web platform that parses resumes into structured data, matches candidates to roles with an explainable score, and generates tailored documents.
View Case Study
Next step
Tell us what your business needs to automate and we'll map out a practical build.
hello@thedevrox.comWe reply to every enquiry within one business day.
 Python
 FastAPI