SaaS / AI
Smart CRM
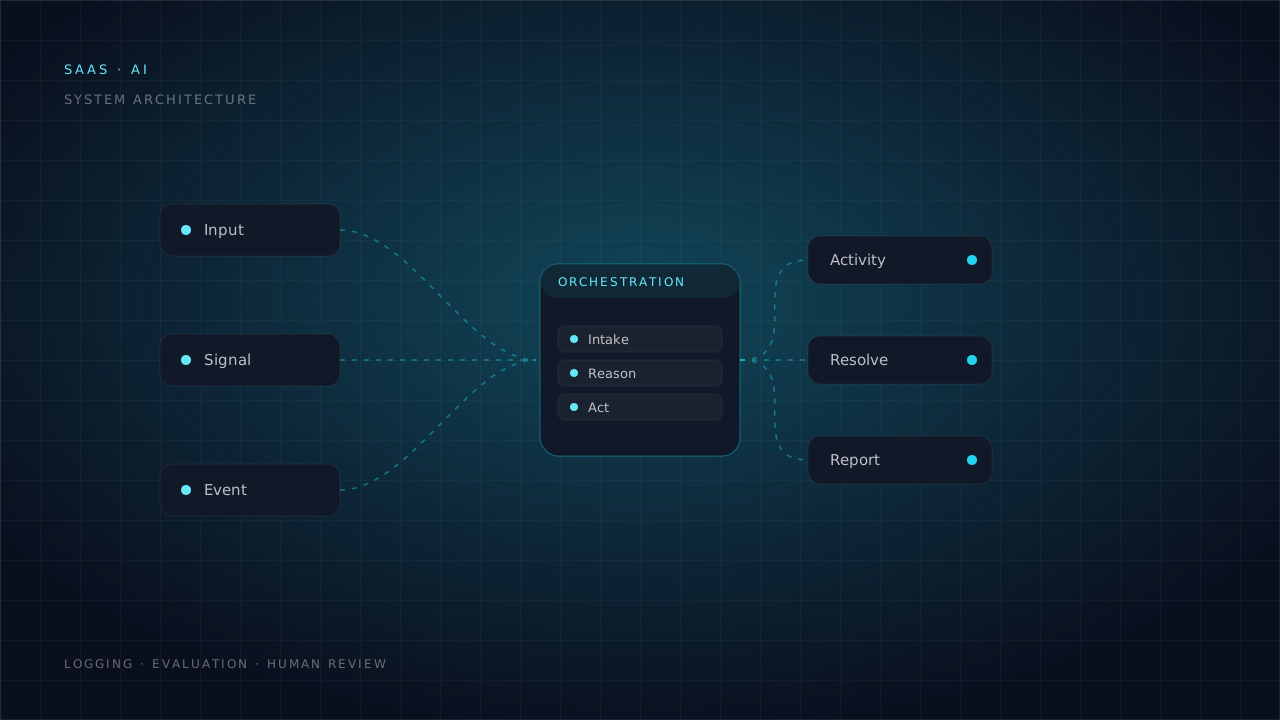
A multi-tenant CRM with AI assistance built into the record, summarising history and surfacing the next action for every account.
- Next.js
- TypeScript
- PostgreSQL
- OpenAI
- +1
View Case Study
Web Apps / SaaS
Unified Merchandising & Margin Analytics
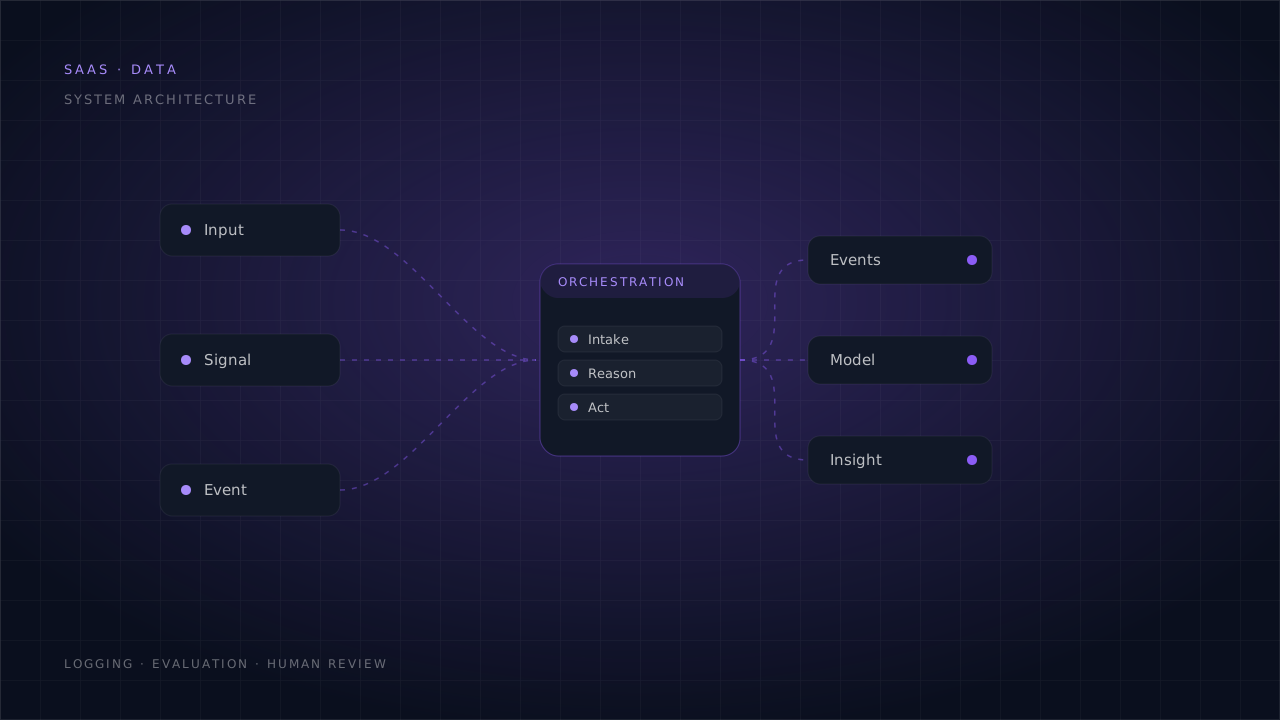
An analytics platform consolidating orders, inventory, advertising and returns into one margin-accurate view of product performance.
Overview
A multi-channel retailer was making buying decisions on revenue because true margin was spread across five systems and reconciled by hand each month. We built a warehouse-backed analytics platform that consolidates orders, cost of goods, advertising spend, fees and returns into a single contribution-margin figure per product — updated daily rather than monthly.
Challenge
Merchandising decisions were made on revenue because margin was only known a month in arrears, after a manual reconciliation across five systems.
Cost, fee, advertising and return data lived in five separate systems.
Reconciliation was a multi-day manual process performed monthly.
Products that looked profitable on revenue were loss-making after returns and ad spend.
Existing reporting timed out on queries spanning more than a quarter.
Solution
We built the margin model once, in the warehouse, and made every view read from it — so no team maintains its own version of the truth.
Built scheduled ingestion from each platform with schema validation and drift detection.
Modelled contribution margin explicitly, with each cost component traceable to its source.
Pre-computed rollups and materialised views to keep large queries interactive.
Replaced monthly reconciliation with a daily refresh and a visible data-freshness indicator.
Added saved views and threshold alerts so teams are notified rather than having to check.
Capabilities
What Commerce Insights Dashboard does in day-to-day use.
Cost of goods, fees, shipping, advertising and returns combined into one figure per product.
Marketplace, direct and wholesale performance normalised into a comparable model.
Sell-through, cover and reorder signalling based on velocity rather than static thresholds.
Returns attributed to product, variant and channel to expose hidden margin loss.
Teams save their own segmentation and receive alerts when a metric crosses a threshold.
Pre-computed rollups keep multi-year, multi-million-row queries interactive.
Stack
The tools this system runs on, grouped by the role they play.
Architecture
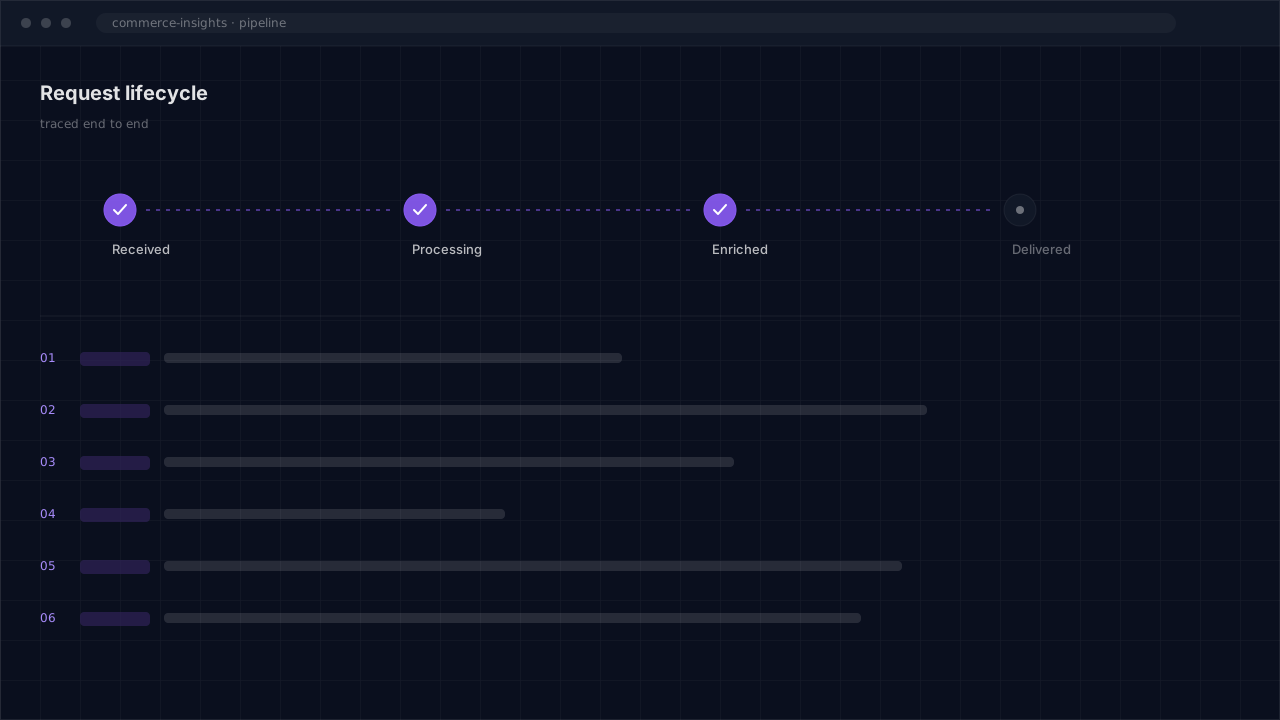
The path a single request takes through the system, end to end.
Each platform is pulled on schedule with schema validation.
Orders, costs, fees and ad spend mapped into one comparable model.
Contribution margin calculated per product, variant and channel.
Materialised views keep interactive queries fast at scale.
Saved views, segmentation and threshold notifications.
Outcome
What changed for the business after launch.
5 → 1
Data sources consolidated
One margin model, one refresh, one source of truth.
Monthly → daily
Margin reporting cadence
Manual reconciliation removed from the finance calendar.
< 2s
Typical dashboard query
Across multi-year, multi-million-row datasets.
18%
Catalogue found loss-making
Products profitable on revenue but negative after fees and returns.
Interface
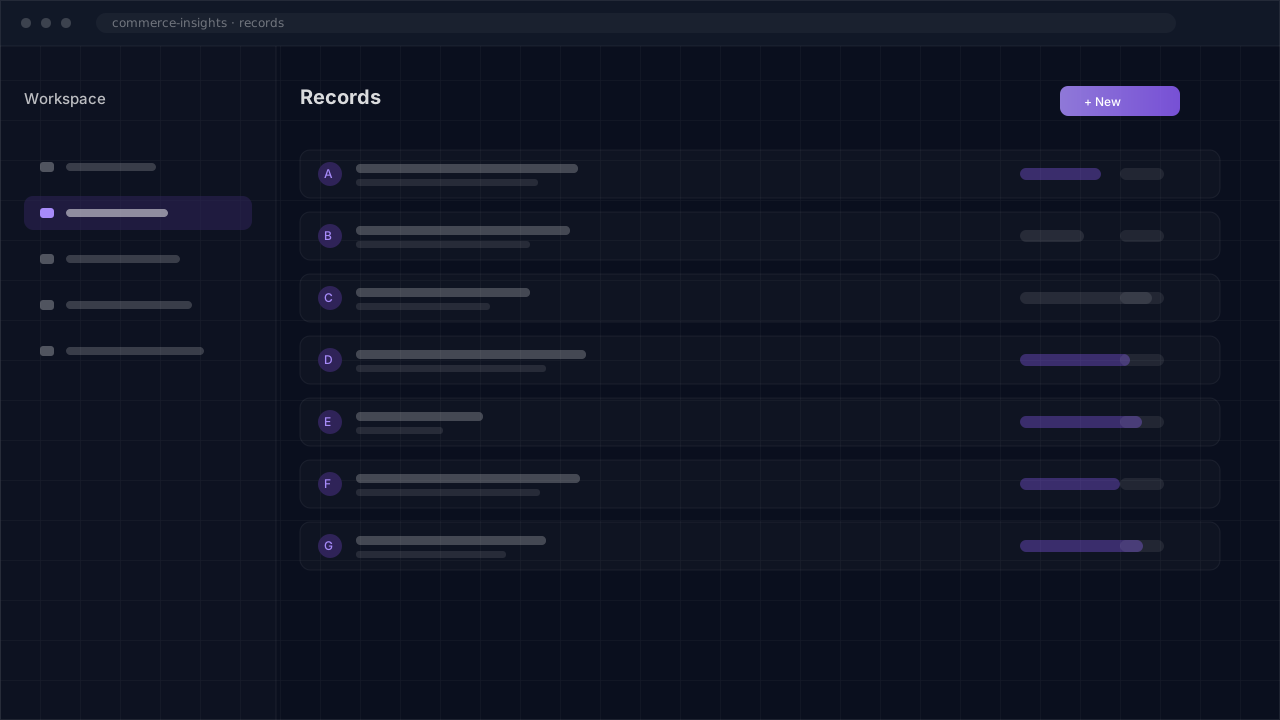
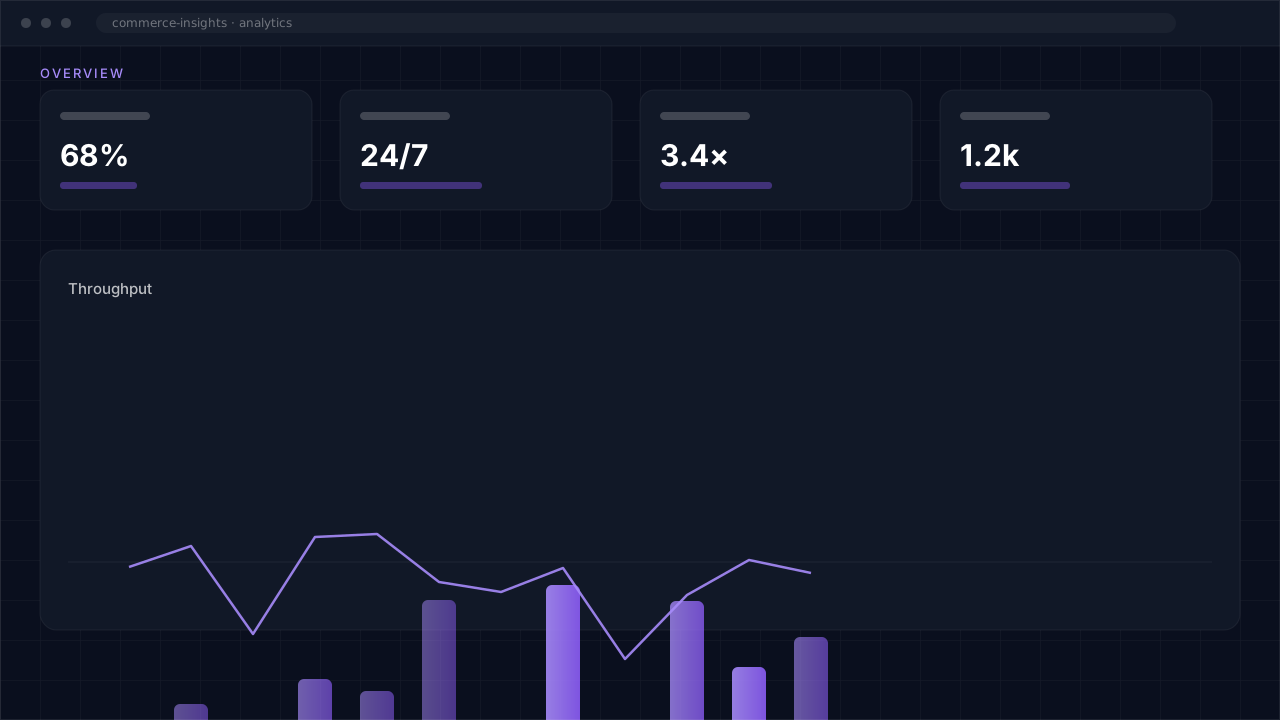
Screens from the delivered system.
More work
Other systems built on similar foundations.
SaaS / AI
A multi-tenant CRM with AI assistance built into the record, summarising history and surfacing the next action for every account.
View Case Study
AI / Web Application
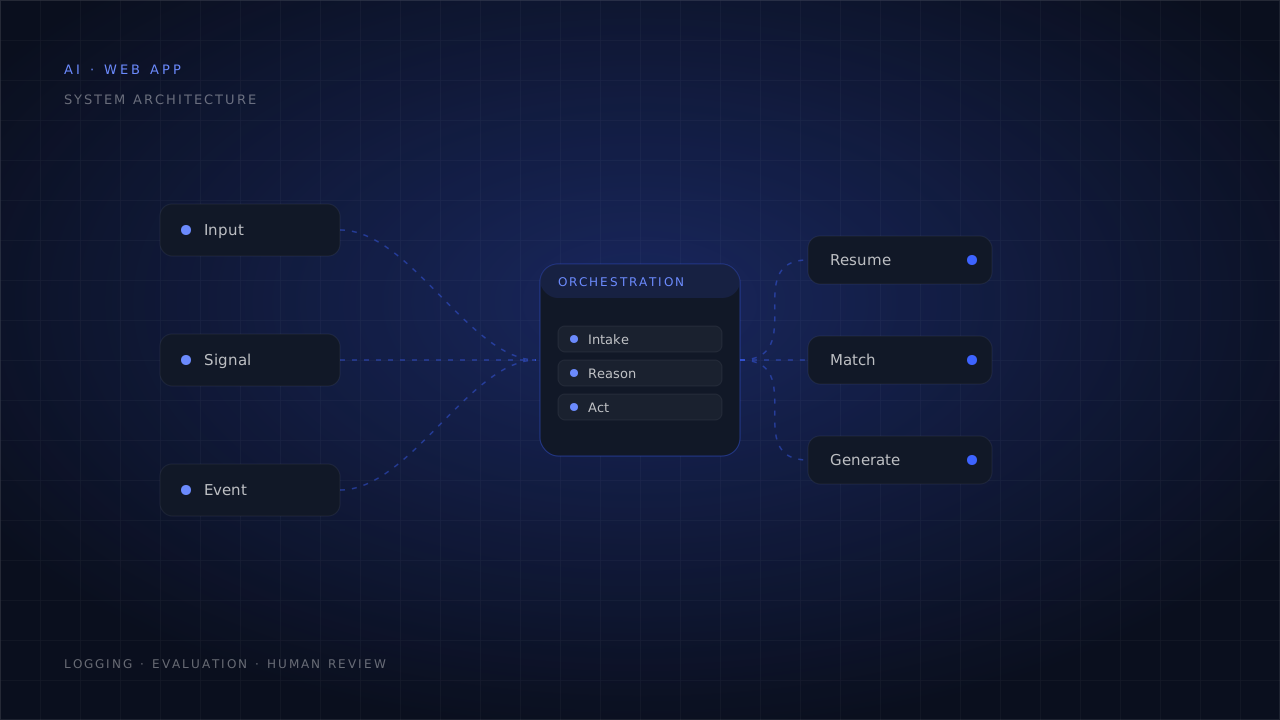
A web platform that parses resumes into structured data, matches candidates to roles with an explainable score, and generates tailored documents.
View Case Study
Next step
Tell us what your business needs to automate and we'll map out a practical build.
hello@devrox.comWe reply to every enquiry within one business day.